For the first time in almost 2 years the S&P 500 is only a couple of points away from its 200 Day Moving Average. This should not be significant, yet it is likely to get market pundits talking as many technical market analyst (e.g. chart readers) use this as a line of demarcation. Their belief is that a market above its 200 day ma has positive momentum and a market below its 200 day ma has negative momentum. Intuitively this makes sense (i.e above average is positive and below average is negative), and basically, by definition, it is true, but there are problems. First and foremost, it is too simplistic. Don’t get us wrong, we are firm believers in Occam’s Razor and try to live by it, but here simplicity does not win out.
As way of example, since we last changed our rating on the S&P 500, from the negative Long Term Downtrend to the positive Long Term Uptrend almost 6 1/2 years ago on 10/12/11, the S&P 500 has breached its 200 Day Moving Average seven times. Two of the breaches, August 2015 and January 2016, were substantial, with each lasting more than two months and creating declines in excess of 10%. Causing investors quite a bit of discomfort. Yet not once during any of these seven breaches did our system indicate the breach was anything more than a setback in the markets continuing advance, as our Long Term Uptrend rating did not change. Fortunately for us that turned out to be the correct posture. And although this market decline is also discomforting, to say the least, all of our ETFs are still rated Long Term Uptrend.
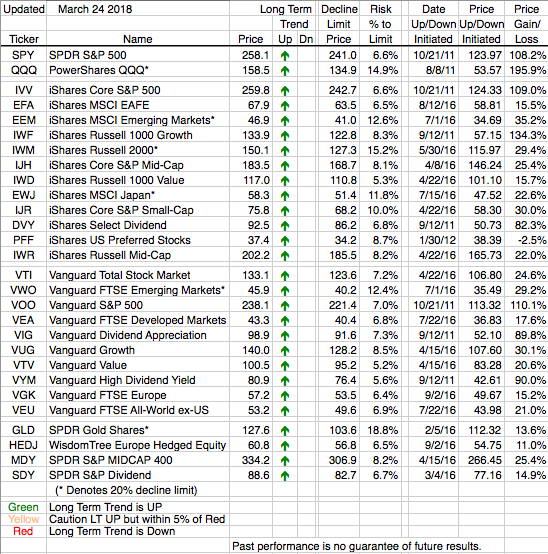
We hope we’re proven to be correct once again but if this time is different ( possibly the most corrosive phrase in the investment lexicon) at least we don’t have to worry about the extent of the market decline because we know what our downside is. Just check the table below under “Decline Limit Price”. That knowledge is the comfort we try to bring to investing.
